



Most toy-store owners I talk to aren't short on data. Their POS spits out dozens of reports, supplier portals track fill rates, the card processor sends monthly summaries nobody opens. The problem is almost never a lack of numbers — it's that the numbers don't connect to a decision, on a schedule, that someone is actually responsible for.
That's what a real KPI taxonomy is. Not a dashboard. A structured set of metrics, each one tied to a specific decision gate — weekly, monthly, or seasonal — with a clear trigger that says "when this crosses this line, do this thing." Without that structure, KPIs become wallpaper. Pretty, ignored, and slowly wrong.
For a store run by one to three people, the stakes are different than for a chain. There's no merchandising analyst. The owner is the analyst, the buyer, and the person unpacking boxes on Tuesday morning. So the taxonomy has to be small, fast to read, and brutally tied to action. This article walks through how the whole system fits together — which metrics matter, how often you actually look at them, and what each one is supposed to make you do.
Why toy-store KPIs break down (even when people track them)
The common failure isn't ignorance. It's that metrics get tracked in isolation, with no cadence and no owner. A store watches its sales number daily because it feels important, but never looks at sell-through by category until they're drowning in unsold Q4 inventory in February.
-
Too many metrics, no hierarchy. Everything feels important, so nothing triggers action.
-
Wrong review frequency. Cashflow gets checked monthly when it needs weekly eyes during peak. Assortment mix gets checked weekly when it really only needs a seasonal pass.
-
No trigger. A metric moves, everyone nods, nobody does anything because there's no pre-agreed line that forces a decision.
Toys make this worse than most retail because of the seasonal skew and age-band complexity. A general store might do 40% of revenue in Q4. Plenty of toy stores do 55–65%. That compression means a metric you ignored in October can't be fixed in December — the buying window already closed. The taxonomy has to respect when a number is still actionable, not just whether it's good or bad.
The 10 metrics that actually earn their place
You don't need 30 KPIs. You need about ten, sorted by how fast they change and how fast you can actually respond. Below is the taxonomy I'd build for a one-to-three-person store, grouped by the decision gate each one feeds.
Never run out of bestsellers again.
GoToyvio helps you monitor inventory and sales to keep your shelves stocked and customers happy.
- Real-time stock tracking
- Automated reorder alerts
- Sales and promotion analytics
No credit card required
| Metric | What it tells you | Review cadence | Decision it drives |
|---|---|---|---|
| Daily sales vs. same-weekday last year | Trend health, promo lift | Weekly (roll-up) | Promo timing, staffing |
| Gross margin % (blended) | Are discounts eating you alive | Weekly | Markdown discipline |
| Sell-through % by category | What's moving, what's dead | Weekly | Reorder / markdown |
| Weeks of supply by category | Overstock / stockout risk | Weekly | Reorder timing |
| Attach rate (items per transaction) | Merchandising & staff effectiveness | Monthly | Bundle & layout changes |
| Inventory turns (annualized) | Capital efficiency | Monthly | Assortment triage |
| Aged inventory % (>120 days) | Dead capital | Monthly | Clearance gates |
| Return rate by category / age band | Merchandising fit problems | Monthly | Buying corrections |
| Gross margin return on inventory (GMROI) | Profit per dollar tied up | Seasonal | Category expansion/cut |
| Repeat purchase rate | Loyalty & family cadence | Seasonal | Marketing & events focus |
A few notes on why these and not others. Weeks of supply matters more than raw unit counts for a small store because it translates directly into "do I reorder now or not." GMROI is the one most owners skip and really shouldn't — a category can have gorgeous margins and still be a cash trap if it turns twice a year. And return rate by age band is toy-specific gold. It tells you when your merchandising is putting the wrong toy in front of the wrong parent, which is a fixable buying problem, not bad luck.
Matching metrics to the right review rhythm
The single biggest fix for tiny teams isn't better metrics — it's putting each metric on the correct clock. Reviewing everything weekly is exhausting and trains you to react to noise. Reviewing everything monthly means you miss fast-moving problems during peak season.
Weekly gate: the 20-minute scan
Weekly is for anything that changes fast enough that a week of delay costs you real money. Sales trend, blended margin, sell-through, and weeks of supply by category. That's four metric families. The goal isn't analysis — it's catching the two or three things that drifted and deciding whether to reorder, mark down, or shift a display.
Keep the weekly review to roughly 20 minutes; if it runs an hour you've loaded too much into it.
Keep it to roughly 20 minutes. If the weekly review takes an hour, you've loaded too much into it and you'll skip it during the exact weeks — November, December — when it matters most.
Monthly gate: the pattern check
Monthly is where you look at attach rate, turns, aged inventory, and returns. These don't move meaningfully week to week, and checking them weekly just adds noise. Monthly you're asking pattern questions: is attach rate slipping because the impulse zone by the register got messy? Is aged inventory creeping past 15% because you bought too deep on a license that cooled off?
Seasonal gate: the big-money decisions
Seasonal review — really four times a year, anchored around buying calendars — is for GMROI and repeat purchase rate. These feed the decisions that are expensive and slow to reverse: which categories to expand, which to cut, whether to lean harder into collector events or family programming. If you've built solid weekly and monthly habits, the seasonal review almost writes itself because you already know where the problems are.
If you want the reporting layer that makes this cadence sustainable, the one-page reporting and governance approach for single-location stores pairs directly with this taxonomy — it's the format that keeps the weekly scan to 20 minutes instead of two hours.
A worked owner/manager weekly review script
Here's an actual script you can run. It assumes two people — an owner and a manager — but it works solo too. Block 20 minutes, same time every week. Monday morning before open is the most common setup.
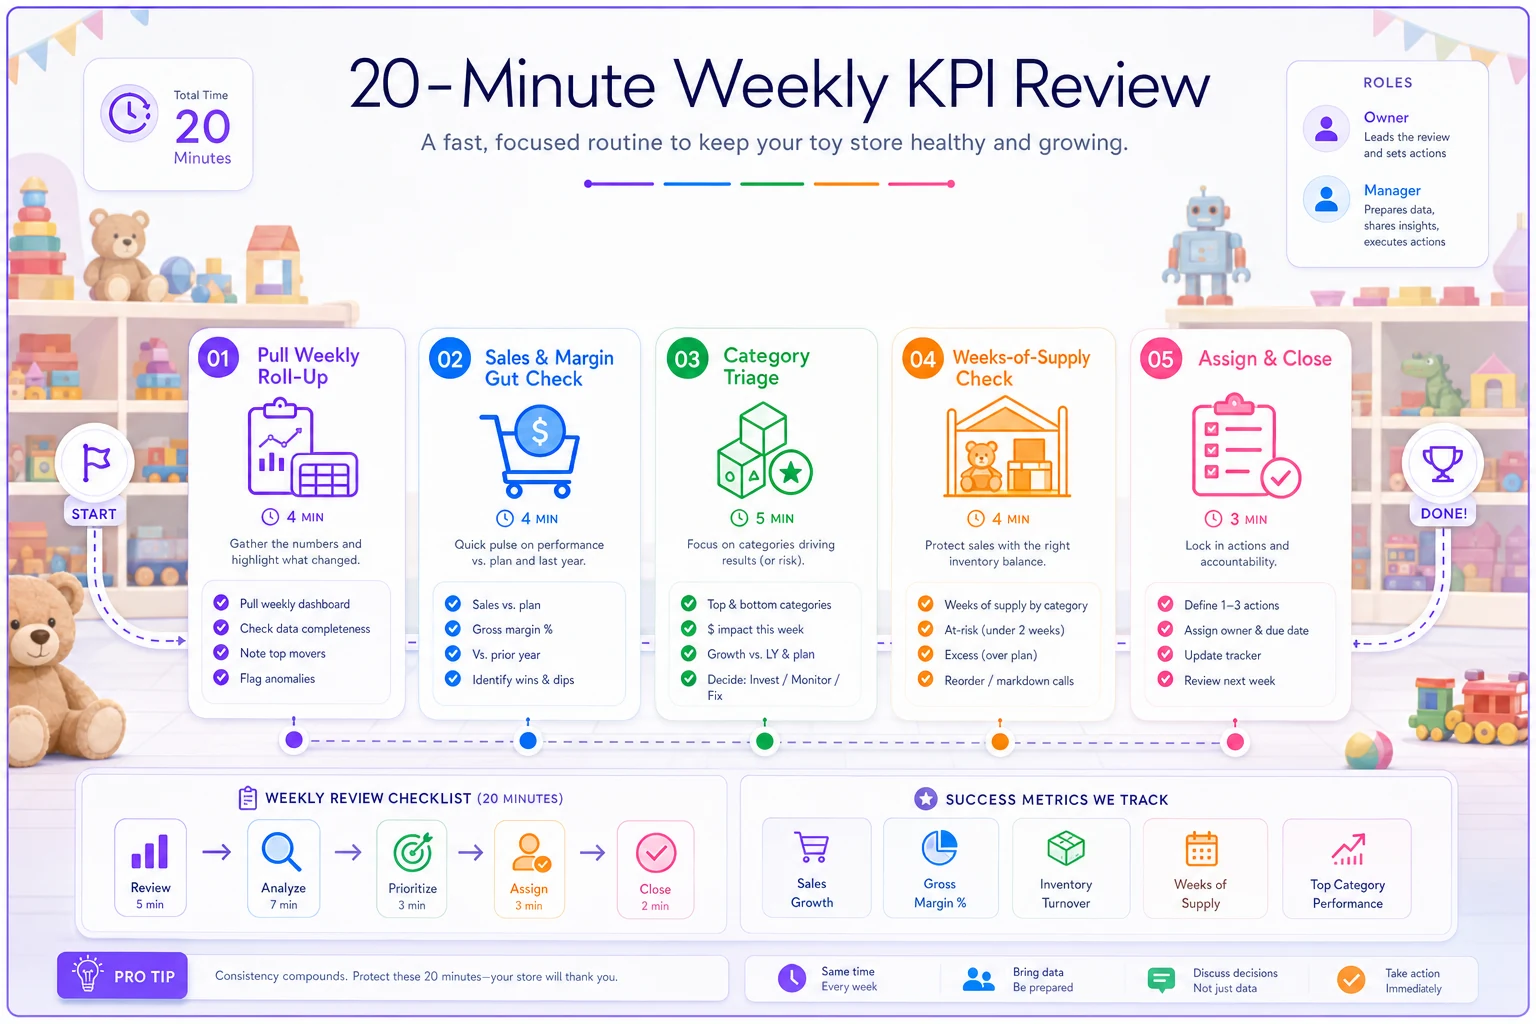
Visualized, the weekly script looks like this:
-
Pull the weekly roll-up (2 min). Sales vs. same weekday last year, blended margin, and the sell-through/weeks-of-supply table by category. One screen or one printed page.
-
Sales & margin gut check (3 min). "Are we up or down vs. last year, and did margin hold?" If margin dropped more than ~3 points, ask why — was it a planned promo or unplanned discounting at the register?
-
Category triage (8 min). Walk the sell-through table top to bottom. For each category, one of three calls: reorder, hold, or flag for markdown. Say the decision out loud and write it down. This is the heart of the meeting.
-
Weeks-of-supply check (4 min). Anything under ~2 weeks going into a strong sales window is a reorder-now flag. Anything over ~12 weeks outside of pre-season buildup is an overstock flag.
-
Assign and close (3 min). Every flag gets a name and a deadline. "Sarah reorders the wooden puzzles by Wednesday. I mark down the leftover summer water toys by Friday." No orphan decisions.
The reason to script it is that unscripted reviews drift into storytelling — "this customer said the coolest thing" — and never land on a decision. The script forces the meeting to end with a short list of actions, owned by a person, with a date attached.
Concrete action triggers (the part most stores skip)
A KPI without a trigger is just trivia. Below are the trigger lines I'd set for a small store. Adjust the thresholds to your own baselines, but have thresholds — that's the whole point.
-
Sell-through below 40% at mid-season for a category → mark down 15–20% now, don't wait.
-
Weeks of supply under 2 with a strong sales trend → reorder immediately, even at a worse cost.
-
Weeks of supply over 12 outside pre-season → stop reordering, plan a clearance.
-
Blended margin drops 3+ points week over week → audit register discounting and promo overlap.
-
Aged inventory (>120 days) crosses 15% of on-hand value → dedicated clearance event within 30 days.
-
Return rate on an age band above ~8% → review the merchandising and packaging signals for that band before the next buy.
-
Attach rate falls below your rolling 3-month average → reset the impulse zone and retrain on add-on suggestions.
The magic isn't the exact numbers. It's that when the line is crossed, the decision is already made. You're not debating in the moment when you're exhausted and it's December. You pre-committed in a calm meeting, so the trigger just executes.
A real scenario: the store that stopped guessing
A two-person store doing somewhere around $480k–$520k a year had a classic problem — strong top-line, thin cash. The owner tracked daily sales religiously and basically nothing else. Margins looked "fine" but the bank account was always tighter than the revenue suggested.
When they mapped out a proper taxonomy, two things fell out fast. First, aged inventory was sitting around 22% of on-hand value — nearly a quarter of their capital frozen in slow licensed goods bought too deep the previous year. Second, GMROI on a couple of "prestige" collector lines was miserable. Gorgeous margins, but the stuff turned barely twice a year and tied up cash that could've funded three faster-moving categories.
They didn't do anything fancy. They ran the weekly triage script, set a 15% aged-inventory trigger, and cut two underperforming collector lines at the seasonal review. Over the following two quarters, aged inventory dropped to roughly 12–13%, and the freed-up cash went into faster-turning preschool and impulse categories. Revenue stayed roughly flat — but cash on hand improved noticeably and the owner stopped doing the end-of-month scramble. Same store, same sales, far less financial stress. That's what the taxonomy actually buys you: not necessarily more revenue, but decisions that compound.
Where a system beats a spreadsheet
You can absolutely run this in a spreadsheet, and plenty of good stores do for years. But two things tend to break as you get busier.
The first is data assembly time. If pulling the weekly roll-up means exporting from POS, pasting into a sheet, and fixing formulas, you'll skip it exactly when you're slammed. Operational software that pulls the numbers automatically and formats the one-page view removes the friction that kills the habit. AI-assisted reporting can also surface the flags for you — "these three categories crossed your reorder threshold this week" — so the review starts from decisions instead of raw data.
The second is consistency across time and people. When it's all in one person's head or one person's spreadsheet, the taxonomy dies the week that person is out. A shared platform with thresholds baked in means triggers fire the same way whether the owner or the part-timer is running the review. That's also what makes the cadence portable if you ever go from one location to two.
None of this replaces judgment. The tools just protect the habit — and the habit is where the value lives.
When this level of structure is overkill
Be honest about your stage. If you're a single owner doing under ~$150k a year, a full ten-metric taxonomy with three review cadences is probably more machinery than you need. Start with four weekly metrics and a monthly aged-inventory check. That's genuinely enough to avoid the worst cash traps.
This full system earns its keep when you're doing enough volume — roughly $300k and up, or running two-plus people — that decisions start slipping through the cracks because no one owns them. That's the inflection point where "we'll remember to reorder" stops being true and the cadence pays for itself.
And if your core issue is cashflow specifically rather than assortment discipline, start there instead. The profit-first cashflow playbook covers ordering windows and promo ROI gates that pair naturally with this KPI structure — get the cash rules solid first, then layer the full metric taxonomy on top.
Putting it together
Ten metrics, three cadences, a scripted weekly review, and pre-committed triggers. That's the whole system. Not knowing more — deciding faster and more consistently with the small amount of time a tiny team actually has.
Most stores already have the data. What they're missing is the wiring between a number moving and a person doing something about it — on a schedule, before the window closes. Build that wiring once, protect the weekly habit, and revisit the thresholds each season. The stores that do this don't necessarily sell more toys. They just stop letting cash freeze in dead inventory and stop scrambling at the exact moments when a small team can least afford to.
Ten metrics, three cadences, a scripted weekly review, and pre-committed triggers. That's the whole system. Not knowing more — deciding faster and more consistently with the small amount of time a tiny team actually has.
Most stores already have the data. What they're missing is the wiring between a number moving and a person doing something about it — on a schedule, before the window closes. Build that wiring once, protect the weekly habit, and revisit the thresholds each season. The stores that do this don't necessarily sell more toys. They just stop letting cash freeze in dead inventory and stop scrambling at the exact moments when a small team can least afford to.
Ready to elevate your toy store operations?
Join 500+ toy retailers using GoToyvio to increase sales, reduce stockouts, and enhance customer loyalty.