



Most toy store P&Ls lie to you. Not on purpose — the numbers are real — but the shape of a standard annual P&L hides the one thing that controls whether your business survives: you make most of your money in about 60 days and spend the other 300 keeping the lights on.
A flat annual view tells you "we did roughly $740k in revenue and kept about 6% net." Fine. But that single number can't tell you whether you can afford to hire a second full-timer in March, whether your spring expansion idea is reckless, or whether the cash sitting in your account in December is actually profit or just inventory money that hasn't turned into bills yet.
A multi-year P&L for a toy store only becomes useful when it's season-adjusted and when it has gates built into it — specific points where you stop and ask, "Based on what the model actually shows, do I hire, expand, invest, or sit still?" That's what this is. Templates, worked examples tuned to toy seasonality, and the decision logic that goes with them.
Why the standard annual P&L fails toy stores specifically
Toy retail has one of the most lopsided revenue curves in all of small retail. Many independent stores do 35–45% of their annual revenue in Q4, with a huge chunk of that landing in the three weeks before Christmas. Add a secondary bump around late spring — birthdays, graduations, early summer — and you've got a business running on two engines that fire at completely different times of year.
When you look at that through an annual P&L, everything averages out. Your "monthly revenue" becomes a fiction. A $740k year reads as roughly $62k/month, but the real distribution looks more like:
-
January–February
$28k–$35k each
-
March–May
$45k–$58k each
-
June–August
$40k–$50k each
-
September–October
$50k–$65k each
-
November
$95k–$120k
-
December
$140k–$180k
The averaged number tells you the business is healthy. The monthly shape tells you that February can quietly bleed you dry if you overbought in Q4, and that every big decision you make should be timed against this curve.
The pattern that trips people up: owners make expansion and hiring decisions in December, when the register is loud and the store feels unstoppable. Then January hits, the curve collapses, and the commitments they made in a dopamine haze are suddenly very real. A multi-year, season-adjusted P&L exists mostly to protect you from your own December optimism.
The three layers your model needs
Layer 1 — Seasonal revenue curve (the shape). Not just totals. The month-by-month distribution, expressed as a percentage of annual revenue, so you can scale it up or down across years without re-guessing the seasonality every time.
Never run out of bestsellers again.
GoToyvio helps you monitor inventory and sales to keep your shelves stocked and customers happy.
- Real-time stock tracking
- Automated reorder alerts
- Sales and promotion analytics
No credit card required
Layer 2 — Cost timing (the mismatch). Your biggest cash outflow — Q4 inventory — happens before your biggest revenue. You're often paying for Christmas stock in August, September, and October while revenue is still modest. Rent, payroll, and insurance stay flat all year regardless. The model has to show these on their real timing, not spread evenly.
Layer 3 — Decision gates (the whole point). Specific checkpoints tied to specific metrics where you decide whether to commit money or stay lean.
Lock your seasonality index separate from annual totals so you can test growth scenarios without changing month percentages.
Most spreadsheet templates you'll find online give you Layer 1 and stop. That's why they feel useless by February.
Building the seasonal curve (fill-in-the-blanks)
Start by pulling your last two full years from your POS, month by month. If you've only got one clean year, use it but widen your buffers.
For each month, calculate its share of the annual total:
> Month % = (Month revenue ÷ Annual revenue) × 100
Average the two years per month. That gives you a seasonality index you can reuse. Here's a template with example figures filled in for a store doing around $740k:
| Month | Yr1 $ | Yr2 $ | Avg % of year | Your % |
|---|---|---|---|---|
| Jan | 31k | 33k | 4.3% | ___ |
| Feb | 28k | 30k | 3.9% | ___ |
| Mar | 48k | 51k | 6.7% | ___ |
| Apr | 52k | 49k | 6.8% | ___ |
| May | 55k | 58k | 7.6% | ___ |
| Jun | 46k | 44k | 6.1% | ___ |
| Jul | 42k | 45k | 5.9% | ___ |
| Aug | 44k | 47k | 6.1% | ___ |
| Sep | 54k | 57k | 7.5% | ___ |
| Oct | 61k | 64k | 8.4% | ___ |
| Nov | 104k | 112k | 14.6% | ___ |
| Dec | 151k | 162k | 21.1% | ___ |
Once you have those percentages, forecasting next year is straightforward: pick a reasonable annual growth assumption and apply the percentages. If you think Year 3 lands around $810k, December is roughly 21% of that — about $170k — and sleepy February is still only ~$32k. The curve stays the same; only the scale changes.
Worth internalizing: your seasonal shape is far more stable than your annual total. Revenue might swing 8–12% year to year, but the distribution across months barely moves unless you fundamentally change your product mix or add a new channel. That stability is what makes the model trustworthy.
Overlaying costs on the real timeline
This is where the model earns its keep. Lay your major costs on the actual calendar, not averaged.
Fixed monthly (flat all year): rent, base payroll, insurance, utilities, software, loan payments. For a store this size, that's roughly $34k–$38k/month before variable costs.
Inventory purchases (lumpy and front-loaded): this is the killer. A typical toy store commits the bulk of Q4 inventory dollars between August and early November. If your Q4 cost of goods is going to be around $150k, you might be writing checks for $45k in September and $60k in October — before November's revenue shows up.
Seasonal labor: extra hours November through December. Could be $12k–$20k on top of base payroll across those two months.
When you stack these, a specific and nerve-wracking picture emerges: September and October are often your tightest cash months of the entire year, even though big revenue is only weeks away. Owners who don't model this get caught short right before their best season, panic-borrow, or cut their Q4 order — which guarantees a weaker December. The cash-flow timing is the real constraint here, and it deserves its own dedicated planning. The profit-first cashflow playbook for independent toy stores goes deep on ordering windows and payroll rules that keep this from happening.
The decision gates — where the model becomes a tool, not a spreadsheet
A three-year P&L without decision rules is just a prettier guess. Gates turn it into something that actually tells you when to act. Here are the four that matter most for toy stores.
Gate 1 — The hiring gate (checked in Feb–Mar, not December)
The temptation to add staff peaks in December when you're drowning. The right time to decide is late winter, looking at the full curve.
A rule of thumb that holds up well: don't add permanent labor against seasonal revenue. A full-time hire is a flat-all-year cost. Only justify it against your flat-all-year revenue floor — your January–February stretch, your slowest months — not against the December high.
The gate: Does the trailing 12-month gross margin, minus current fixed costs, leave enough cushion to absorb a new salary through your two slowest months without going negative? If the answer requires December to bail you out, it's a seasonal hire, not a permanent one.
Gate 2 — The expansion gate (second location, bigger lease)
This one sinks more toy stores than any other decision. A second location doubles your fixed costs immediately and roughly doubles your Q4 inventory cash requirement — but your existing store's customer base doesn't transfer.
The gate I'd set: expansion only makes sense when your existing store has produced two consecutive years of positive net cash after owner pay, and when your off-season (January through August combined) at least covers all fixed costs on its own. If your current store only survives because of Q4, a second location just gives you two stores that live or die in December. That's not growth, that's doubled fragility.
Gate 3 — The inventory reinvestment gate
Checked in July, before you commit the big Q4 order. Look at last year's Q4 sell-through by category and your current cash position after the September/October squeeze is modeled out.
The gate: If I place this order, does my modeled cash balance stay above my minimum threshold in every month, including the October low point? If not, the order gets trimmed — ideally by cutting slow-turning categories, not across the board. Knowing which SKUs to cut is its own discipline; a cash-aware assortment framework makes that triage far less painful than guessing.
Gate 4 — The owner-investment gate (renovation, POS, marketing push)
Discretionary spend should be gated to the post-Q4 window when you actually know your real year-end position — usually late January, after returns settle and December numbers clear.
The gate: fund major discretionary projects only from confirmed net profit above your target reserve, never from projected Q4 revenue. The number of owners who renovate in November assuming Christmas will cover it, then spend January scrambling, is not small.
A worked three-year example
A realistic scenario. Store starts at roughly $720k, owner wants to understand whether a second full-timer in Year 2 and a modest expansion in Year 3 are viable.
Year 1 (baseline, ~$720k)
-
Gross margin ~46% → ~$331k gross profit
-
Fixed costs (rent, base payroll, insurance, etc.) ~$255k
-
Seasonal labor ~$16k
-
Net before owner draw
~$60k
-
Off-season (Jan–Aug) covered fixed costs? Barely — about 94%. Q4 carried the rest.
Gate check for Year 2 hiring: The off-season doesn't quite cover fixed costs on its own, so adding a ~$42k permanent salary against that floor is risky. Decision: hire part-time seasonal instead, revisit in a year. The model just saved this owner from a commitment the slow months couldn't support.
Year 2 (~$770k, with a part-time hire + marketing invested from Year 1 profit)
Gross profit ~$354k
Fixed costs ~$262k
Net before draw: ~$68k
Off-season now covers ~101% of fixed costs. The floor finally lifted above the waterline.
Gate check for Year 3 expansion: Two conditions needed — two years positive net and off-season covering fixed costs. Year 2 just hit the second condition for the first time. That's one year, not two.
Decision: do not expand in Year 3. Reinvest in deepening the existing store and confirm the off-season floor holds for a second consecutive year. If Year 3 repeats the pattern, Year 4 becomes a legitimate expansion conversation — from strength, not hope.
That's the whole value of the exercise. The owner wanted to expand in Year 3. The season-adjusted model, with gates, said "not yet, and here's exactly why." An annual P&L showing three years of positive net income would have flashed green. The gated model didn't.
A clean build checklist
Work through these in order and you'll have a model that actually guides decisions:
-
[ ] Pull 24 months of monthly revenue from your POS
-
[ ] Convert each month to a % of annual revenue; average across years to get your seasonality index
-
[ ] Project three years of annual totals with a conservative growth assumption (4–7% tends to be realistic)
-
[ ] Apply the seasonality index to distribute each year's revenue by month
-
[ ] Lay fixed costs flat across every month
-
[ ] Place inventory purchases on their real timing (front-loaded into Aug–Oct)
-
[ ] Add seasonal labor to Nov–Dec only
-
[ ] Calculate a running monthly cash balance — find your lowest point (usually Sept/Oct)
-
[ ] Set a minimum cash threshold and mark any month that breaches it
-
[ ] Write your four gate rules as explicit if/then statements tied to specific cells
-
[ ] Review the model at each gate's calendar point — not whenever you feel like it
Build the model in a repeatable workflow so updates don't become a second job.
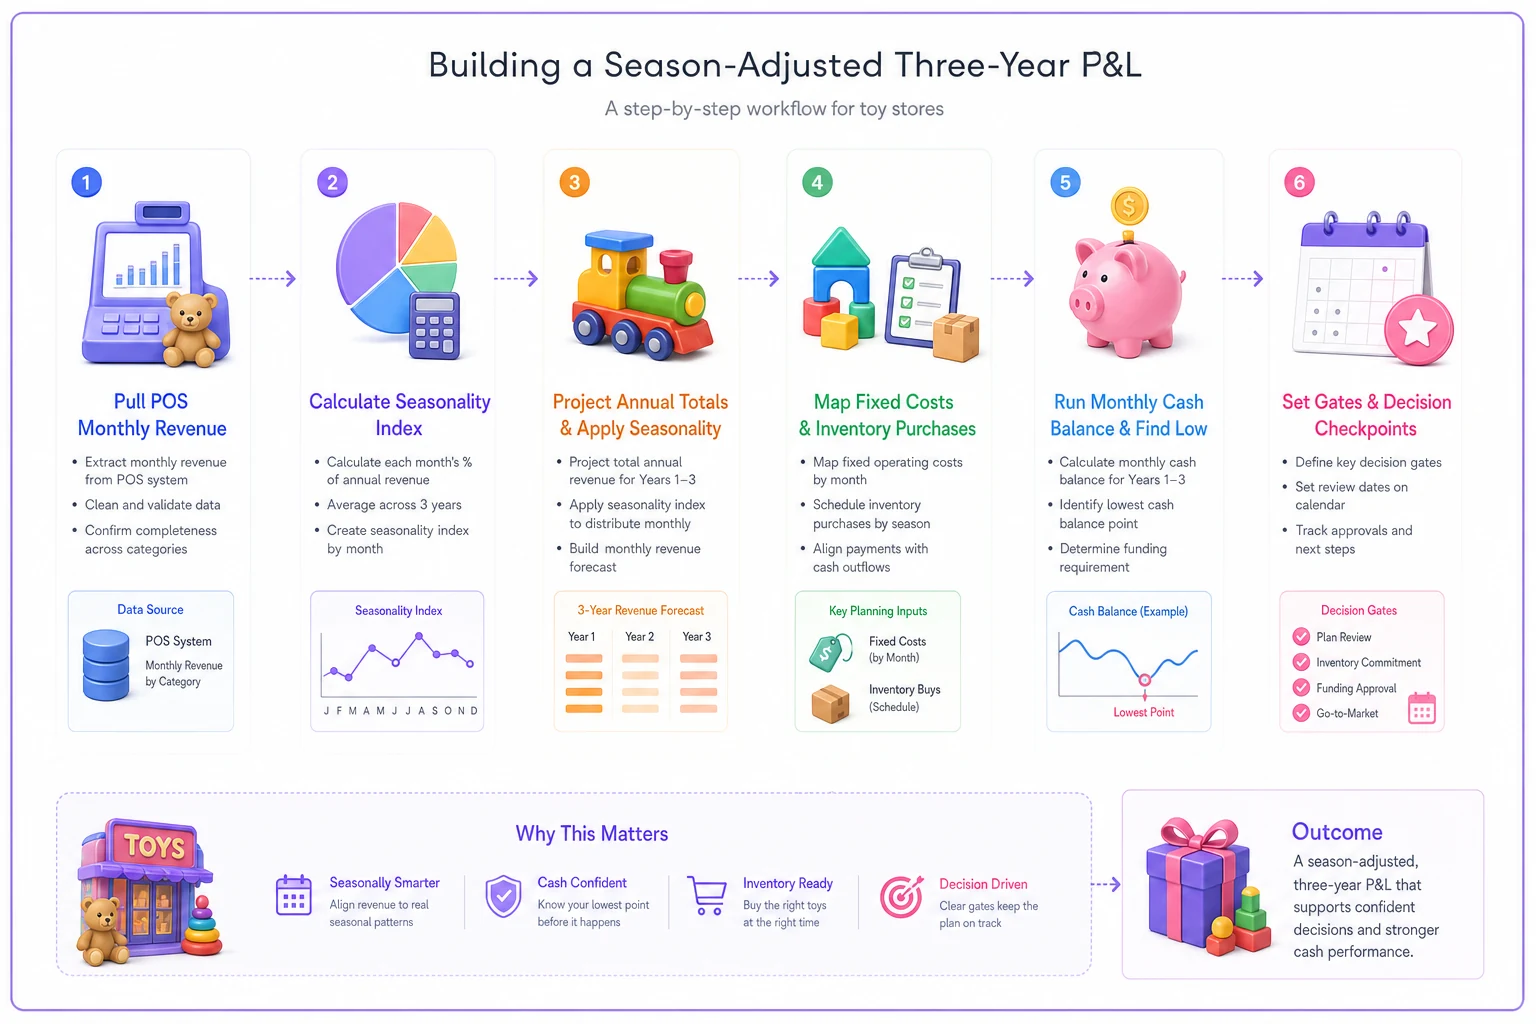
This flowchart helps you keep the build repeatable and ensures the gate calendar is visible.
When this level of modeling is overkill
If you're doing under roughly $200k and running the store mostly solo, a full three-year gated model is more machinery than you need. A simple seasonal cash calendar — just the monthly curve and your fixed costs — will catch most of the danger. Build the full model when you start having real decisions to make: first hire, first expansion thought, first big reinvestment.
It's also the wrong tool if your sales history is too chaotic to trust. A store that's only a year old, or one that just changed its entire product category, doesn't have a stable seasonality index yet. Model with wide buffers and revisit once you've got two clean years under your belt.
And if you're the kind of owner who'll build the spreadsheet and then ignore it when December excitement hits — the model won't save you. The gates only work if you actually honor them when the register is loud.
Keeping the model alive without drowning in spreadsheets
The hardest part isn't building the model — it's keeping it current without it becoming a second job. Owners who stick with it tend to reconcile actuals against the model once a month, right after closing the books, and they let their POS or planning tool pull the monthly revenue numbers automatically rather than re-keying everything manually. The less friction in the update, the more likely you are to actually check it before making a decision. A model you update twice a year is a model you'll ignore in September when you need it most.
Whatever tooling you use, the principle is the same: your revenue data should flow into the model with minimal hand-entry, so the only thing you're actively doing is making the decision — not rebuilding the spreadsheet every quarter.
A season-adjusted three-year P&L doesn't give you precision. Your forecasts will be wrong at the edges every single year. What it gives you is timing discipline — a reason to make permanent commitments against your floor instead of your peak, and a built-in pause before every big check. Toy retail punishes owners who confuse a loud December with a strong business. The model is just a way of asking, calmly and in advance, "If I do this, does every month of the next three years still clear?" Most of the time, that one question is worth more than the whole spreadsheet.
Ready to elevate your toy store operations?
Join 500+ toy retailers using GoToyvio to increase sales, reduce stockouts, and enhance customer loyalty.